May 2016:
March 2014:

Thursday, April 20, 2017

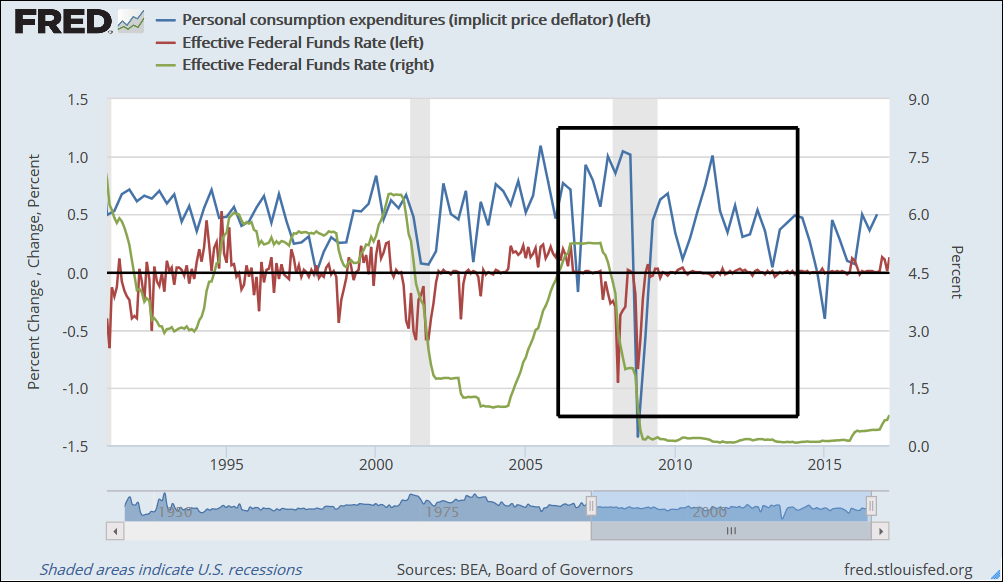
Looks like the user-defined lines work better now!

https://fred.stlouisfed.org/graph/?g=dreS


The black box shows the start & end of the Bernanke period (Feb 1 2006  to  Feb 3 2014, according to Wikipedia). I drew the lines, then captured the image, then got the "Page short URL" link & looked at it. The box came back just like I drew it!

Nice.

Sunday, April 2, 2017

It's one of the most discussed economic numbers on the face of the planet


At FRED, search for gross federal debt. 32 series in the search results.

Select the Frequency tag for Quarterly data. The list is reduced to 16 series.

Select the Geographies tag for United States of America. Seven series remain. Six of these are "Percent of GDP, Quarterly, Seasonally Adjusted". The odd man out is "Billions of Dollars, Quarterly, Seasonally Adjusted". That's what I want, billions. That series is Federal Government Debt: Gross (DISCONTINUED), for the period Q1 1953 to Q4 1998. Nothing current.

If you want to know Gross Federal Debt in billions, quarterly, don't go to FRED.

Thursday, December 8, 2016

Because I need the User-defined line settings

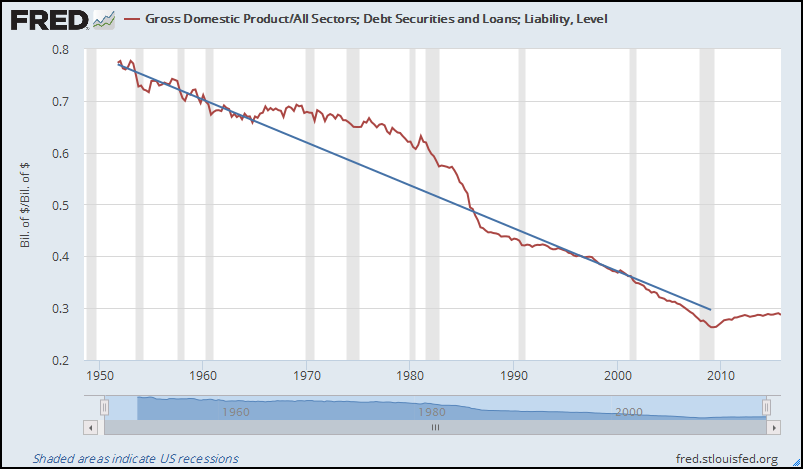
Created a simple ratio graph at FRED and put a user-defined line on it:


Then I created a link to the Page Short URL. Then I said Oh, my trend line is gonna be messed up. So I looked at it, to see:


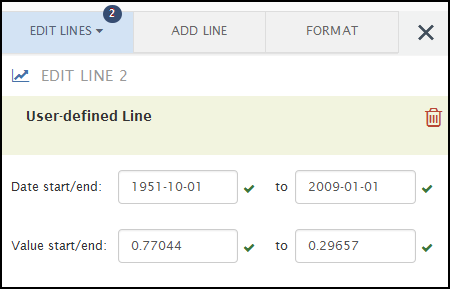
Sure enough. The user-defined line put my end-value at 2016, not at 2009 where I had it. Obviously they saved the value I specified for the end of the user-defined line, but they didn't save the date. Great.

(Or maybe they save the date, but don't apply it when they reconstruct the graph. That would be a much easier fix!!)

For the record, here's the data I specified for the user-defined line:


And here's the data as returned by FRED c4Kd:


I didn't check, but FRED probably doesn't save (or apply) the start-date for the user-defined line, either.
Monday, November 28, 2016

"Create user-defined line? Create user-defined line? Create line"

Unbelievably, FRED lets you create a line by specifying the endpoints, but does not let you put the line on the right-hand axis.

(Also, it seems not to remember the end-date you specify, when you save a link to your graph.)

Tuesday, November 8, 2016

418,000 US and international time series from 79 sources ...

418,000 US and international time series from 79 sources, but nothing on Gross Federal Debt before 1939:

Sunday, October 16, 2016

Why why why why why?

I go to FRED to look for data and to look at data. Sometimes I have to hunt. Sometimes I know what I'm looking for. When I know what I'm looking for I can just type the name into the search box and get the graph. Sometimes.

Sometimes not. Sometimes I get this:


Why? Why give me a list with one thing on it? Why not just give me the thing?

This problem comes up a lot. I've noted it here and here, for example. Well, it's not a "problem" I guess. But it's annoying.