May 2016:
March 2014:

Monday, November 20, 2017

It doesn't know it's limited to four user-defined lines

This is a funny one.

Not ha-ha funny. I'm looking at financial deregulation and what happened to debt in the 1980s and 1990s. I put Federal debt and non-Federal debt on a graph. Then I figured I'd put a vertical line at each date a regulation changed. (I only had four dates; no big deal.) I used FRED's "user-defined line" option to add these verticals.

Then I wanted to add two more verticals, to identify the start and end of the Savings & Loan crisis. So I told FRED to add a fifth user-defined line (my 7th line overall) but it came up as LINE 6 again, with the location-values I had just entered for LINE 6. I said that's not right, and tried again. Same thing. LINE 6 came up again.

Okay, I said, I guess we're limited to four user-defined lines. (Why that should be, I don't know.) But then I looked at the FORMAT area, where I can change line colors and thicknesses and stuff. LINE 6 is listed THREE TIMES!
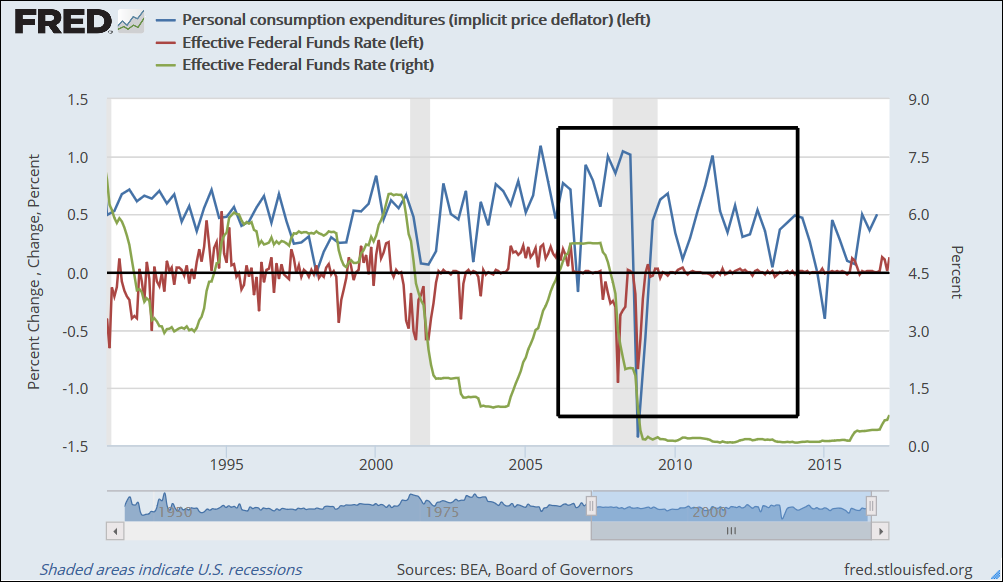
See for yourself:


(Click the image to see it bigger.)

If you change the color for ANY of the LINE 6 entries, the first LINE 6 entry always indicates the new color, and the line on the graph changes to match the setting.

If you change the line width for any of the LINE 6 entries, your new width-value stays where you put it. But the first LINE 6 entry is the only one that actually changes the line width.

I didn't try changing the line style.

This was a pretty entertaining error. I was trying to figure out why the line changes when you change any of the LINE 6 color controls, but the line width only changes when you change the first LINE 6 width control. They don't use the same code, I'm thinking.

Anyhow, a good solution to this problem would include increasing the maximum number of user-defined lines that can be added to a graph. And I still don't know why, in order to create a user-defined line, I have to click Create user-defined line? and then after the screen changes, click Create user-defined line? again, and then after the screen changes again, click Create line.

But I'm sure there is a good reason for it.

Sunday, October 1, 2017

A user-defined nightmare

I made a FRED graph showing one blue line. I drew a red box around the 1948-1978 period using four user-defined lines. Got the "page short URL" link. Clicked the link.

The red box was messed up. The horizontals start okay (at 1948) but continue out to end-of-data (2016?). The verticals also start okay (one at 1948 and one at 1978) but both end at end-of-data. (For each of my verticals, the end-year should be the same as the start-year.)

I made one change: I selected 1980 as the end date to display on the graph. Basically, I made the graph system conscious of an end-date. Then I corrected the user-defined data for the red box.

I got a new page short URL for the revised graph. This time when I clicked the link, the red box was okay.

It looks to me that there is some date-initialization that is not being done by the graph system code, or that is done at the wrong time.

messed up graph: https://fred.stlouisfed.org/graph/?g=fggi#0

corrected graph: https://fred.stlouisfed.org/graph/?g=fggA#0

Thursday, September 14, 2017

Gone are the days

From my econ blog:

Graph #1: Net Change in the Medium of Exchange due to Household Debt

The description of the calculation (in the upper blue border of the graph) has been cut short by a devious and disappointing FRED. The full description is "(Households and Nonprofit Organizations; Credit Market Instruments; Liability, Level-Monetary interest paid: Households and nonprofit institutions)*(100/Consumer Price Index for All Urban Consumers: All Items)"

Back when I started making FRED graphs, the graph told you specifically which of the hundreds of thousands available datasets were shown on the graph. And by reading both the graph title area and the vertical axis label you could determine the exact calculations used to generate the plotted numbers. You could duplicate somebody else's FRED graph. Somebody else could duplicate yours. There was no question about what the graph showed.

This is no longer the case today.

Thursday, April 20, 2017

Looks like the user-defined lines work better now!

https://fred.stlouisfed.org/graph/?g=dreS


The black box shows the start & end of the Bernanke period (Feb 1 2006  to  Feb 3 2014, according to Wikipedia). I drew the lines, then captured the image, then got the "Page short URL" link & looked at it. The box came back just like I drew it!

Nice.

Sunday, April 2, 2017

It's one of the most discussed economic numbers on the face of the planet


At FRED, search for gross federal debt. 32 series in the search results.

Select the Frequency tag for Quarterly data. The list is reduced to 16 series.

Select the Geographies tag for United States of America. Seven series remain. Six of these are "Percent of GDP, Quarterly, Seasonally Adjusted". The odd man out is "Billions of Dollars, Quarterly, Seasonally Adjusted". That's what I want, billions. That series is Federal Government Debt: Gross (DISCONTINUED), for the period Q1 1953 to Q4 1998. Nothing current.

If you want to know Gross Federal Debt in billions, quarterly, don't go to FRED.