May 2016:
March 2014:
Saturday, May 9, 2015
Inflexible Economists
In Inflexible Trends, I showed the new FRED Graph tool for adding lines to a graph. It's not bad. It has its uses. But they insist on calling their line a "trend line" when clearly it isn't. It's a straight, connect-the-dots line.
Here's the first graph from the FRED Blog of 7 May 2015...
... along with the settings that establish their trend line: start-point and end-point dates and values. But if you look at the graph, the data (blue) is almost entirely below the red trend line.
Actually it looks as if the blue line spends most of its time curving back up toward the red line. If I was going to show a trend line for that graph, I think I'd show a sharp drop-off just after the recession, followed by a gradual curve back toward what FRED calls a trend line.
And there's the real problem I want to point out today: Economists too often insist on thinking of trends as straight lines. That's not the way the world is.
Sunday, April 12, 2015
Inflexible Trends
When you make a graph at FRED, the first series you use establishes the start- and end-dates for the default display.
Maybe you start with a series that runs from 1947 to 2014. Then you add another series and divide the one by the other. But the new one you added only starts in 1967 maybe. So the computer cannot figure the first 20 years anymore, because it's a number you have, divided by a number you don't have. So they just leave that out.
But the default dates don't change. (That's probably a good thing.) So you are left with a plot area that starts at 1947, and a plotted line that only starts in 1967. The first 20 years of your graph show blank white space.
If you look at FRED graphs people have made, you'll often find those big white spaces in the starting years. You can find it on a lot of my FRED graphs, for sure. Maybe you never noticed. But now that you know about it, you'll see it all the time.

I started with a FRED graph showing Total Financial Assets (FRED's TFAABSHNO). The data runs from 1949 to 2014. Then I added the M1ADJ series (M1 Adjusted for Retail Sweeps) which runs from 1967 to 2013. So of course the plot area was blank for the years 1949-1966. Then I added a trend line to the graph. That's a new feature at FRED. Here's what I got:
| Graph #1 |
What happened? The guys that added the trend line routine to the FRED code forgot to check where the data starts. They just went with the default start-date. And so that's what the graph shows.
This is funny stuff.
I knew about the reverse-order thing that I described above. So I created the graph again, from scratch. But this time I started with the series that starts in 1967, then added the series that starts in 1949. So by default, there is no blank white space. The years before 1967 are simply not shown.
Then I added the trend line again, and here's what I got:
| Graph #2 |
Then I noticed that the trend line is good for maybe the first dozen years and for the last few, and otherwise it is way the hell off from where it should be.
And then I noticed that they don't even do a trend calculation. The red line starts at the first value of the blue line, and ends at the last value of the blue line. And what they call a "trend line" is really just a straight line from the first blue point to the last blue point.
That's embarrassingly bad, I think.

But hey, don't take my word for it. Let's see what Excel gives us.
That's more like it.
Cross posted at The New Arthurian Economics
Friday, January 30, 2015
Christian Zimmermann has a bad day
FRED Blog says this graph "shows how the composition of M2 has changed over time." Sounds about right; that, and that the graph shows the components "as shares of total M2."
But that's not what the graph says. The graph says it shows "(Billions of Dollars)". If that is correct, then the graph shows that M2 money has been stable at 100 billion dollars since 1960. It shows that M1 money (the top edge of the green region) is now about 25 billion dollars, half as much as it was in 1960.
Hard to believe.
Of course, it is the label of the vertical axis that is wrong. The graph doesn't show billions of dollars. It shows percent of total M2.
This is an error in the "new" FRED Graphing routines -- one of many errors that still exist in those routines. The old FRED Graphing routines were pretty much free of such errors. Gone are the days.
I miss the old FRED.
Thursday, October 23, 2014
Return of the Dredded Orange Bar
At FRED on the morning of the 22nd...
Uh-oh, I've seen the orange bar before. It means change is a-brewing at FRED.
That can't be good.
Hey, I clicked the thing. Got this:
Yeah, okay. Answered a few questions, skipped a few questions. Got this:
No good. I'm not allowed to skip questions. Even if I don't have an answer, I should make something up. That's what they want.
Oh, yeah, that's how you get valid responses.
//
I can't wait to see how they fuck FRED up this time...
Wednesday, October 22, 2014
It's not a glitch. It's just FRED.
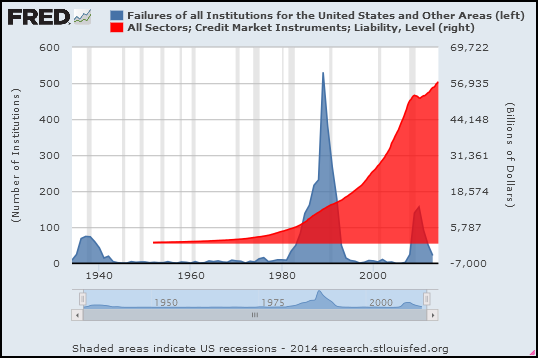
From the FRED blog I took their Bank Failures graph and added total (TCMDO) debt (red):
Thought it was odd that the red area was floating up above the horizontal axis. But whatever, it's not my graph. It's FRED.
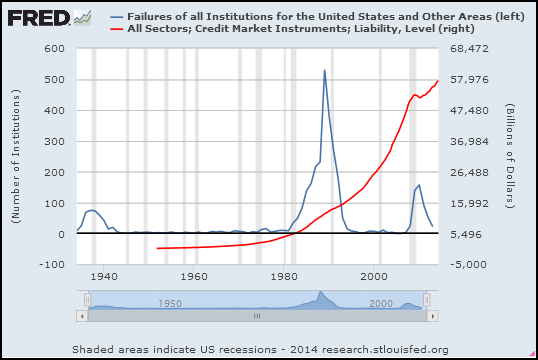
I didn't want an area graph. Changed it to a line graph. Here's what I got:
The red line sank down and now starts below the x axis.
Weird. The numbers shouldn't change, when I change the style of the graph.
Wednesday, September 17, 2014
Sunday, September 7, 2014
Unsaid at FRED
Reblogged from my economics blog
At FRED Blog: How much money is the Fed printing?
To answer that question they look at currency in circulation. Two graphs.
First graph:
Before 1960, flat. After 1960, straight-line increase.
The graph uses natural log values to show growth rates. As the FRED post says, "if the slope is the same for two years, the growth rate is the same." A more upward slope is faster growth. A less upward slope is slower growth.
The FRED post says the values are "indeed increasing, but there is no indication that it is accelerating". In other words: The line goes up, yes, but after the early 1960s it doesn't curve up.
Second graph:
Graph #2 shows the same money as Graph #1 but shows it a different way. No "log" numbers. Instead, the graph compares the quantity of money to GDP. On Graph #2 we have downtrend to about 1985, and then uptrend: The currency component of M1 grew more slowly than GDP in the early years, and more quickly than GDP in the late years. I want to say the change occured around 1985.
Leave out the years before 1960 where Graph #1 has the flat trend. Look at the years since 1960, where #1 shows a straight-line uptrend.
From 1960 to 1985 the trend is down on Graph #2. After 1985 the trend is up. And yet, as the FRED Blog says, Graph #1 shows no acceleration.
Graph #1 shows that currency growth did not change. Graph #2 shows that either currency growth or GDP growth did change. We have to put the two facts together in our head: Either currency growth or GDP growth did change, but currency growth did not change. Therefore, GDP growth changed.
Voila.

To confirm, I took a quick look at the numbers.
During the 25 years from 1960 to 1985, currency in circulation increased by a factor of 5.6. During the 25 years from 1985 to 2010, currency in circulation increased by a factor of 5.5. Almost exactly the same. So, a straight line increase it is. As FRED said.
During the first 25 years GDP increased by a factor of 8.0. That's faster than currency growth, so the line on Graph #2 goes down between 1960 and 1985.
During the second 25 years GDP increased by a factor of 3.4. That's slower than currency growth, so the line on Graph #2 goes up between 1985 and 2010.
Currency growth was the same for the two periods, even though the "Great Inflation" is entirely contained in the earlier period. Currency growth was the same, but GDP growth was different. GDP growth was much faster in the early period, and much slower in the second.
Let's draw a conclusion
At FRED Blog: How much money is the Fed printing?
To answer that question they look at currency in circulation. Two graphs.
First graph:
| Graph #1: Quantity of Money, in Natural Log Values |
The graph uses natural log values to show growth rates. As the FRED post says, "if the slope is the same for two years, the growth rate is the same." A more upward slope is faster growth. A less upward slope is slower growth.
The FRED post says the values are "indeed increasing, but there is no indication that it is accelerating". In other words: The line goes up, yes, but after the early 1960s it doesn't curve up.
Second graph:
| Graph #2: Quantity of Money Relative to GDP |
Leave out the years before 1960 where Graph #1 has the flat trend. Look at the years since 1960, where #1 shows a straight-line uptrend.
From 1960 to 1985 the trend is down on Graph #2. After 1985 the trend is up. And yet, as the FRED Blog says, Graph #1 shows no acceleration.
Graph #1 shows that currency growth did not change. Graph #2 shows that either currency growth or GDP growth did change. We have to put the two facts together in our head: Either currency growth or GDP growth did change, but currency growth did not change. Therefore, GDP growth changed.
Voila.

To confirm, I took a quick look at the numbers.
During the 25 years from 1960 to 1985, currency in circulation increased by a factor of 5.6. During the 25 years from 1985 to 2010, currency in circulation increased by a factor of 5.5. Almost exactly the same. So, a straight line increase it is. As FRED said.
During the first 25 years GDP increased by a factor of 8.0. That's faster than currency growth, so the line on Graph #2 goes down between 1960 and 1985.
During the second 25 years GDP increased by a factor of 3.4. That's slower than currency growth, so the line on Graph #2 goes up between 1985 and 2010.
Currency growth was the same for the two periods, even though the "Great Inflation" is entirely contained in the earlier period. Currency growth was the same, but GDP growth was different. GDP growth was much faster in the early period, and much slower in the second.
Subscribe to:
Posts (Atom)