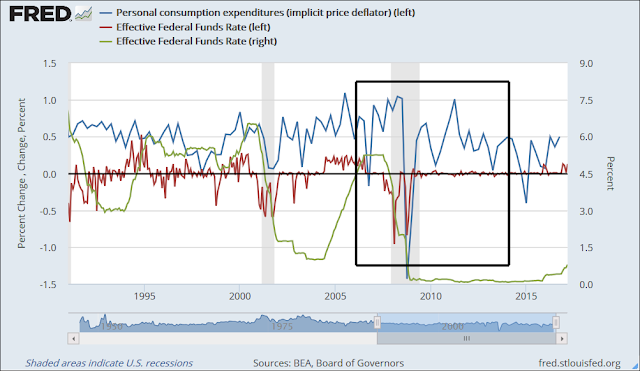
https://fred.stlouisfed.org/graph/?g=dreS
The black box shows the start & end of the Bernanke period (Feb 1 2006 to Feb 3 2014, according to Wikipedia). I drew the lines, then captured the image, then got the "Page short URL" link & looked at it. The box came back just like I drew it!
Nice.
May 2016:
 March 2014:

 March 2014:
Thursday, April 20, 2017
Sunday, April 2, 2017
It's one of the most discussed economic numbers on the face of the planet
At FRED, search for gross federal debt. 32 series in the search results.
Select the Frequency tag for Quarterly data. The list is reduced to 16 series.
Select the Geographies tag for United States of America. Seven series remain. Six of these are "Percent of GDP, Quarterly, Seasonally Adjusted". The odd man out is "Billions of Dollars, Quarterly, Seasonally Adjusted". That's what I want, billions. That series is Federal Government Debt: Gross (DISCONTINUED), for the period Q1 1953 to Q4 1998. Nothing current.
If you want to know Gross Federal Debt in billions, quarterly, don't go to FRED.
Subscribe to:
Comments (Atom)
